
Introduction
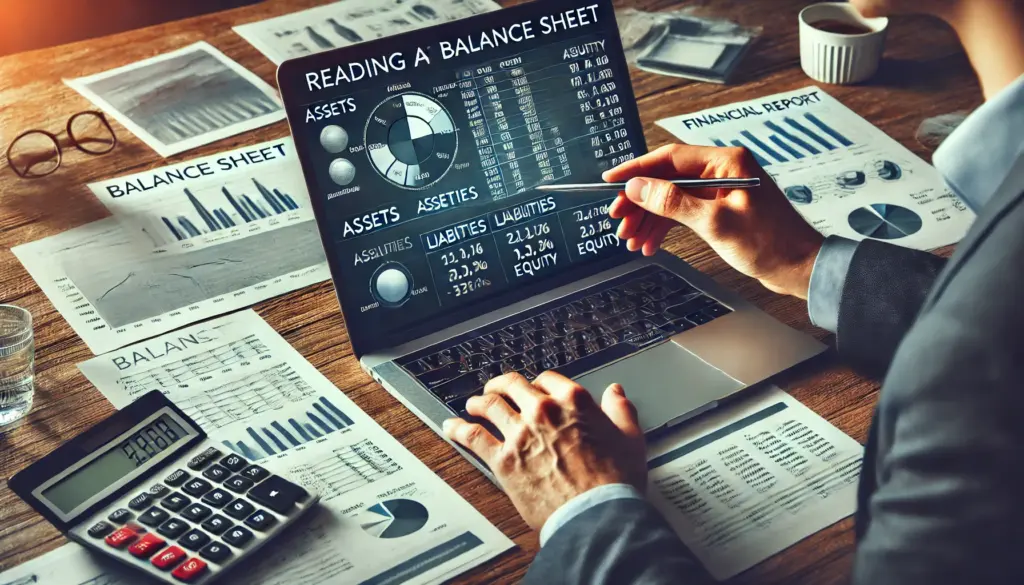
Reading a balance sheet can feel intimidating, especially if you’re new to the world of finance. However, understanding the basics of this crucial financial statement is essential for anyone looking to invest wisely or evaluate a company’s health. A balance sheet provides a clear snapshot of a company’s assets, liabilities, and shareholders’ equity at a given point in time. By learning how to interpret these figures, you’ll gain the power to make more informed decisions—whether you’re picking stocks, managing a business, or just starting out on your financial journey.
In this article, we’ll break down the key components of a balance sheet, explain how they fit together, and show you how to use this information to gauge a company’s overall financial well-being. Let’s dive in!
Table of Contents
What Is a Balance Sheet?
A balance sheet is a financial statement that outlines a company’s assets, liabilities, and shareholders’ equity at a specific date. Often referred to as the “statement of financial position,” the balance sheet aims to demonstrate the company’s net worth. It’s called a “balance” sheet because the total assets must always equal the combined total of liabilities and shareholders’ equity:
Assets=Liabilities+Shareholders’ Equity
This fundamental equation is the backbone of accounting and offers a quick way to check whether the books are, quite literally, in balance.
Why Reading a Balance Sheet Matters
- Evaluating Financial Health: A balance sheet reveals how financially stable a company is by comparing what it owns versus what it owes.
- Identifying Liquidity: Investors and creditors use the balance sheet to assess whether a business can meet short-term obligations.
- Supporting Investment Decisions: By analyzing historical balance sheets, you can identify trends—like growing debt levels or diminishing cash reserves—that might influence your decision to invest.
- Spotting Red Flags: Rapid increases in liabilities or declines in shareholder equity can be a sign of trouble.
Understanding these core principles allows you to assess risk more accurately and make smarter choices about where to place your money.
Key Components of a Balance Sheet
1. Assets
Assets are resources that the company owns or controls and expects will provide future economic value. Assets are typically classified into current and non-current (or long-term) categories:
- Current Assets: These include cash, accounts receivable, inventory, and other resources expected to be converted to cash or used up within a year.
- Non-Current Assets: Also called long-term assets, these include property, plant, equipment (PPE), intangible assets like patents or trademarks, and long-term investments.
Why They Matter
Knowing a company’s assets helps you see if it has enough resources to cover short-term expenses, fund new projects, or weather financial storms. An asset-heavy company may be well-positioned for expansion but could also face higher maintenance costs.
2. Liabilities
Liabilities are obligations the company owes to others—such as loans, accounts payable, or outstanding wages. Like assets, liabilities fall into current (due within a year) and non-current (due in more than a year) categories.
- Current Liabilities: These include short-term debt, accounts payable, and other obligations that must be paid within one year.
- Long-Term Liabilities: These can involve bonds payable, long-term loans, or pension obligations.
Why They Matter
Liabilities show how a company finances its operations—either through debt or other forms of borrowing. High levels of debt can be risky, especially if the company’s revenue streams are unstable. However, judicious use of leverage can also stimulate growth.
3. Shareholders’ Equity
Shareholders’ equity represents the owners’ claim on the company’s assets after all liabilities have been paid off. It typically includes:
- Common Stock: The nominal value of shares issued.
- Retained Earnings: Profits reinvested in the company instead of being paid out as dividends.
- Additional Paid-In Capital: Capital paid by shareholders over the nominal value of the stock.
Why It Matters
A growing shareholders’ equity often indicates that a company is profitable and reinvesting in its own growth. Declining equity might suggest shrinking profits, stock buybacks, or issues meeting liabilities.
The Balance Sheet Equation
Every balance sheet must adhere to the basic accounting equation:
Assets=Liabilities+Shareholders’ Equity
This equation ensures that every resource (asset) is matched by a claim (either by creditors or owners). If a balance sheet doesn’t “balance,” it signals a serious error in the accounting process.
How to Read a Balance Sheet Step by Step
- Identify the Reporting Date
- Check the “as of” date at the top of the document. Balance sheets are snapshots in time, so it’s essential to compare multiple periods to spot trends.
- Scan the Asset Section
- Look for changes in current assets like cash and accounts receivable. Large increases could signal growing sales or better cash management, while decreases might reflect issues with collections or liquidity.
- Review Liabilities
- Compare the current liabilities to the company’s current assets. If current liabilities greatly exceed current assets, the firm might struggle to cover its short-term debts.
- Examine Shareholders’ Equity
- Check if retained earnings are growing. Sustained increases could mean the company is consistently profitable. Also, look out for negative equity—it can signify deeper financial problems.
- Calculate Key Ratios
- Liquidity Ratios (e.g., Current Ratio, Quick Ratio)
- Debt-to-Equity Ratio (to gauge leverage)
- Return on Equity (to measure profitability relative to shareholder investment)
By following these steps, you can piece together a clear picture of a company’s financial stance.
Interpreting Balance Sheet Ratios
1. Current Ratio
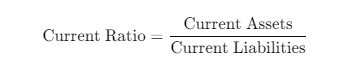
- What It Tells You: How well a company can meet short-term obligations with short-term assets.
- Rule of Thumb: A ratio above 1 often suggests a comfortable liquidity position.
2. Quick Ratio
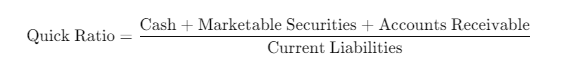
- What It Tells You: The company’s ability to pay off short-term liabilities using only its most liquid assets.
- Rule of Thumb: A ratio of 1 or higher implies the company can handle short-term debt without needing to sell inventory or secure additional financing.
3. Debt-to-Equity Ratio
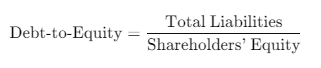
- What It Tells You: How leveraged the company is—i.e., how much debt it uses to finance operations compared to equity.
- Rule of Thumb: A lower ratio typically indicates lower financial risk, but this can vary by industry.
4. Return on Equity (ROE)
- What It Tells You: How effectively the company generates profits from shareholders’ investments.
- Rule of Thumb: Higher ROE can signal strong profitability, but consider the industry average and debt levels.
Balance Sheet in the Bigger Picture
A balance sheet is just one part of a company’s financial puzzle. It’s best used in tandem with:
- Income Statement: Reveals how revenue and expenses are managed over a specific period.
- Cash Flow Statement: Shows actual cash inflows and outflows, clarifying the company’s liquidity beyond accounting adjustments.
- Annual Report & Notes: Additional details on accounting policies, management’s discussion, and operational highlights.
When reading a balance sheet, remember that numbers can be influenced by accounting methods. For instance, inventory valuation methods (LIFO vs. FIFO), depreciation schedules, and intangible asset valuations can impact reported values significantly.
Common Pitfalls to Avoid
- Ignoring Industry Differences: Leverage, inventory turnover, and asset composition can vary widely by sector. Always benchmark against industry norms.
- Overlooking Off-Balance-Sheet Items: Some liabilities, like leases or pension obligations, might not be fully captured if they’re “off-balance-sheet.” Check the footnotes.
- Focusing on One Statement Alone: A balance sheet is powerful, but it’s not the whole story. Combine insights from income and cash flow statements for a well-rounded view.
- Misreading One-Time Events: Large acquisitions, write-downs, or restructuring can create unusual spikes or dips in assets and liabilities.
Practical Example (Hypothetical Scenario)
Imagine you come across TechNova Inc., a growing software company:
- Assets: \$500 million
- Current Assets (cash, receivables) make up \$200 million
- Long-Term Assets (software IP, office buildings) total \$300 million
- Liabilities: \$300 million
- Current Liabilities are \$100 million
- Long-Term Liabilities (mainly bonds) are \$200 million
- Shareholders’ Equity: \$200 million
By applying the accounting equation, we verify
$500M Assets=$300M Liabilities+$200M Equity
Key Takeaways:
- Current Ratio = 2.0 ($200M ÷ $100M) – indicates solid short-term financial health.
- Debt-to-Equity = 1.5 ($300M ÷ $200M) – TechNova Inc. is somewhat leveraged, but not excessively so for a tech firm.
- Trends: If TechNova’s current liabilities spike over time or equity declines, it could signal that debts are mounting or that profits are diminishing.
How to Use This Knowledge for Investment Decisions
- Compare Multiple Periods: Track how a company’s balance sheet evolves over quarters or years.
- Look for Consistency: Steady growth in assets and equity with manageable liabilities is often a good sign.
- Investigate Sudden Changes: Rapid increases in debt or decreases in assets demand further research.
- Evaluate Market Conditions: Sometimes debt is taken on to finance expansion—this isn’t always negative if the market is growing.
- Combine Quantitative & Qualitative Analysis: Use your balance sheet findings with market trends, competitive analysis, and management insights.
Conclusion
A balance sheet can tell you a great deal about a company’s financial foundation—how liquid it is, how much it relies on debt, and how well it might handle future challenges. By mastering the basics of assets, liabilities, and shareholders’ equity, and digging into vital ratios like the current ratio and debt-to-equity, you’re on your way to making better-informed choices, whether you’re investing in the stock market or analyzing your own business.
Now that you have a clearer understanding of balance sheets, keep honing your skills by looking at real-world examples. Compare companies in different industries, spot trends, and learn the nuances of accounting practices. With each balance sheet you read, you’ll build financial literacy that will serve you well on your journey toward wealth creation and financial freedom.
Ready to dive deeper?
- Explore our other guides on income statements and cash flow statements.
- Subscribe to wealthypot.com for more expert insights and tips on building your financial future.
Share this article if you found it helpful, and invite your friends to join the conversation on sound financial analysis. Together, we can all become more confident, savvy investors and entrepreneurs!